


Next, we moved into finding the theoretical probability (what SHOULD happen) when tossing two coins. We discovered that we should have HT/TH about 1/2 of the time, HH 1/4, and TT 1/4 of the time when tossing. We also discovered that once we combined all of our data, our pie chart should look like spinner 2 from yesterday.

Once we had our theoretical probability, we could now experiment. Each student tossed 2 coins recording whether the coins landed HH, TT, or HT, until there was a "winner" (the first one to reach the end of the row).

We used fractions to describe the results of our experiment. Then, we used our data to determine how close we came to our theoretical probability both individually, and as a class.
Mrs. Johnson's class tossed a total of 613 times. This meant that their graph should have about 153 TT, 153 HH, and 306 HT combinations.

Mrs. Dittrich's class tossed a total of 534 times. This meant that there graph should have about 133 HH, 133 TT, and 266 HT combinations.

Mrs. Whitehead's class tossed a total of 587 times. This meant that their graph should have about 146 HH, 146 TT, and 292 HT combinations.

As you can see from the visuals, all three classes have similar pie charts. Tomorrow, we will combine all three classes to see if our theoretical probability and our experimental probability are any closer.
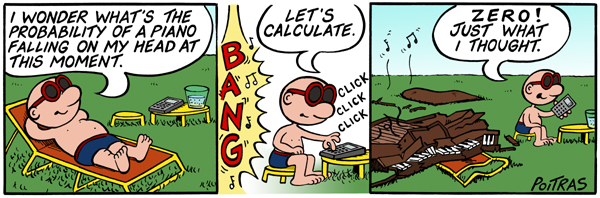
To finish out the day, I asked the kids to create a comic strip about probability. The prompt was:
Create a comic strip that explains the thinking needed to understand probability.
I can't wait to see what they come up with!
HOMEWORK: Countdown 3.5 and Comic Strip
No comments:
Post a Comment