
To make a dot plot in class, I wanted to have a little fun. So, I posed the question...
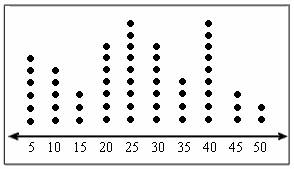
How many drops of water will a penny hold?
I gave each of my six tables a penny, eye dropper, and a container with water. I began by having them predict the number of drops. This prediction is typically around 5... however, the actual data is much higher!
I circled the room, monitoring the drops of water. The dropper cannot be too high from the penny, nor should it be too close. The drops should not be tiny, in fact, they should all be about the same medium size. Be sure not to wiggle the table... and so on and so on.

The kids were shocked to find that a penny holds quite a few drops of water. This is because of the meniscus formed by the water, creating a "bubble" that rises above the penny. This is due to surface tension. Once the surface tension breaks... off flows the water!


We finished off our day with a Countdown to STAAR.
No comments:
Post a Comment