Twelve Days of Christmas


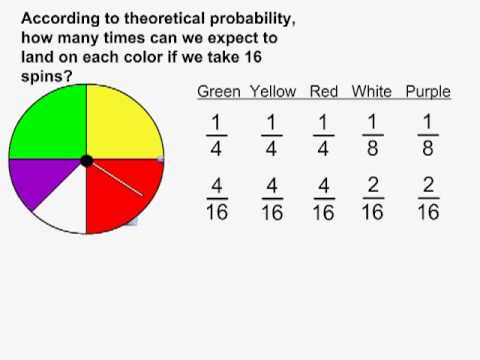
First, we determined our fraction, then we used calculators to find the decimal, and then converted our decimal into a percentage. As we worked, we were comparing our data to the theoretical data (what SHOULD have happened). If it was exact, we circled it. If it was a 1% difference, we placed a check mark. If it was more than a 1% difference, we placed an 'x'.

As you can see, we had two pieces of data that were exact. We had 6 more pieces that were a 1% difference, and only 2 that were more than a 1% difference! We discussed our data and drew a few conclusions:
- Our experimental data as a 5th grade was much closer to the theoretical data.
- If we had a fourth classroom in 5th grade and were able to add another set of data our experimental data would probably be even more closely related to the theoretical data.
The kids did a final circle graph. Then they were asked to compare the 5th Grade Experimental Data Graph to the Theoretical Data Graph and describe an observation.
HOMEWORK: None!
This will be my last post until January 6.