About Me

My photo
Welcome to my math blog! The purpose of this blog is to help you stay informed about our learning and experiences that have taken place during our math class. I have also included links your child (and you) may want to use in order to supplement math learning in 5th grade.

Thursday, April 28, 2016

Musical Literature Day


We did not have regular classes today, instead we celebrated Grimm's fairytales with crafts, games, and two musicals.  The first musical, Groovin' with the Grimms, was put on by our K-4 graders and the second musical, Rats!, was put on by our 5th graders.


Don't forget:

Wednesday, April 27, 2016

Genius Hour

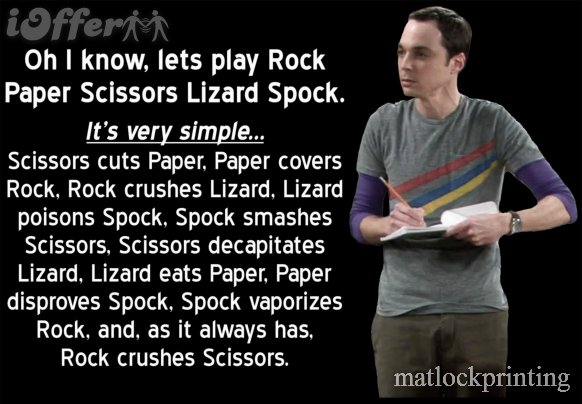
Before beginning Genius Hour,   I wanted to touch base with the kids on the game Rock, Paper, Scissors, Lizard, Spock.  


We looked at all of the possible combinations:


We found that there were 10 wins, 10 losses, and 5 ties, we discussed whether or not this was a fair game.  Most agreed that it was a fair game since you have the same number of losses and wins.  They felt that, since a tie doesn't benefit either player, it did not matter that there were fewer chances to get a tie.


We spent the entire class researching topics and designing products!  We also completed a Weekly Reflection to guide our hour next week.


Tuesday, April 26, 2016

Rock, Paper, Scissors, Lizard, Spock

Today, I asked the kids if they have ever watched The Big Bang Theory and seen Sheldon play Rock, Paper, Scissors, Lizard, Spock!  


I asked the kids if they thought that adding the lizard and Spock to the mix would turn a fair game into an unfair game. To determine their answer mathematically,  I asked the kids to:

Evaluate the fairness of this game.
Justify your reasoning.

I asked them to use one of the visual models (t-chart, branching or matrix) to list all possible outcomes of this game.  Then, determine if the game is fair and JUSTIFY (or explain) how they came to this decision.

We finished out the day completing a Countdown to STAAR and then working on passing lessons on Think Through Math.

Monday, April 25, 2016

Rock, Paper, Scissors (Is it a fair game?)


Today we played the game "rock, paper, scissors."  However, our play had a purpose.  Before playing the game, I asked the kids if the game was a fair game.  We turned to mathematics to find out.  In order to determine if "Rock, Paper, Scissors" is a fair game, we needed to list all possible outcomes of the game.  We did this by using the three visual models that we used with the 2 Coin Toss (t-chart, branches, and a matrix).  


Using these three visuals, we were able to determine that Rock, Paper, Scissors IS a fair game.  There are three ways to win, three ways to lose, and thee ways to tie.  

Now, we needed to determine the theoretical probability (what SHOULD happen) when we played the game.


We discovered that each of the events should occur 1/3 of the time.  Therefore, when we play the game, we should be able to gather our data and create a pie chart that is divided evenly into thirds.


Time to play.... I mean experiment!  We each grabbed a partner and played until we had reached the end of one row.  Once we finished the game we recorded our tallies in the form of fractions and compared our theoretical data with our experimental data.  For example, the game I played with a student SHOULD have had us winning, losing, and tying 8 times each.  Instead, I had 8 ties, 8 losses, and 15 wins.  Therefore, my theoretical probability and my experimental probability were not compatible.


However, when we combined the data from all the students in a class, our data and our graph was MUCH closer!

  • Mrs. Dittrich's class had a total of 420 games.  Therefore, there should have been about 140 wins, 140losses, and 140 ties.


  • Mrs. Dabbs' class had a total of 360 games.   Therefore, there should have been about 120 wins, 120 losses, and 120 ties.

  • Mrs. Johnson's class had a total of 420 games.  Therefore, they should have had about 140 wins, 140 losses, and 140 ties.


Once again, the kids were thrilled to see that their graphs came out almost exactly as expected.....forgetting that this is what was SUPPOSED to happen!  I love it!

Once again, I will combine the three class's data at the beginning of class.  They can't wait to see if we have a perfect pie chart divided into three equal pieces!


Friday, April 22, 2016

Genius Hour (research and product design)


We spent the entire class researching topics and designing products!  We also completed a Weekly Reflection to guide our hour next week.

Thursday, April 21, 2016

Probability with Coins

We began by combining the data from all three classes to see how our theoretical probability and our experimental probability compared:


The classes felt it was pretty impressive!

We continued our work with probability by working with two coins.  We began by defining probability (the likelihood an event will happen).  Today we listed all of the possible outcomes using three different models:  t-chart, branching, and a matrix.  To see our lesson, please watch the video:  2 Coin Toss.


Next, we moved into finding the theoretical probability (what SHOULD happen) when tossing two coins.  We discovered that we should have HT/TH about 1/2 of the time, HH 1/4, and TT 1/4 of the time when tossing.  We also discovered that once we combined all of our data, our pie chart should look like spinner 2 from yesterday. 


Once we had our theoretical probability, we could now experiment.  Each student tossed 2 coins recording whether the coins landed HH, TT, or HT, until there was a "winner" (the first one to reach the end of the row).

 We used our data to determine how close we came to our theoretical probability both individually, and as a class.

Mrs. Dittrich's class tossed a total of 440times.  This meant that their graph should have about 110 TT, 110 HH, and 220 HT combinations.


Mrs. Dabbs' class tossed a total of 521 times.  This meant that there graph should have about 131 HH, 131 TT, and 256 HT combinations.


Mrs. Johnson's class tossed a total of 400 times.  This meant that their graph should have about 100 HH, 100 TT, and 200 HT combinations.


As you can see from the visuals, all three classes have similar pie charts.  Tomorrow, we will combine all three classes to see if our theoretical probability and our experimental probability are any closer.

To finish out the day, I asked them to predict what will happen tomorrow when we combine the data from our two-coin toss.  I asked them to give me a visual and explain why they thought this would be the outcome.

Wednesday, April 20, 2016

Probability with Spinners

I LOVE probability!  It's is probably my favorite of all my units (pun intended!)!  Today we focused on spinners and working with:

  • theoretical probability (what SHOULD happen) 
  • experimental probability (what DID happen)
We began by defining probability.  Probability is the likelihood that an event will happen.  I gave the students a spinner that was broken into fourths.  We found the theoretical probability of landing on each color in fraction form.  Then we discovered how many times we should land on each color if we used our spinner 20 times.  


Once we had determined our theoretical probability, we then worked with the experimental probability.  Each student (and I) spun 20 times and recorded our data.  Next, we compared our individual data to the theoretical data.


Then we combined the data from all the students in each class into a shared Google Sheet and used the "SUM" formula to calculat the totals.  We used our totals to make a circle graph.  Amazingly enough, we found that the circle graphs we created with our data were almost exact replicas of the spinner we began with!  The kids were most impressed!  Here is our data with its circle graph:

Mrs. Dittrich's class spun 320 times, so each color should have had a total of 80.  You can see our data was very close.


Mrs. Dabbs' class spun a total of 380 times, so each color should have had a total of 95.


Mrs. Johnson's class spun a total of 400 times.  Each color should have a total of 100.


We repeated the process with a second spinner.  


We looked at our individual experimental data in comparison with the theoretical data, and then we combined our data into a set of classroom data.  Again, our combined data morphed into a circle graph that looked very similar to the spinner we began with!


Mrs. Dittrich's class spun a total of 320 times.  Red should have been spun 160 times, with blue and yellow being spun 80 times.  You can see from the data and graph below, their experimental data was very close to the theoretical data:


Mrs. Dabbs' class spun a total of 380 times.  Red should have been spun 190 times, with blue and yellow being spun 95 times.  You can see from the data and graph below, their experimental data was very close to the theoretical data:


Mrs. Johnson's class spun a total of 400 times.  Red should have been spun 200 times, with blue and yellow being spun 100 times.  You can see from the data and graph below, their experimental data was very close to the theoretical data:


Tomorrow, we will combine all of the data from the three classes to see how close our experimental data will be to the theoretical data.

Our exit ticket prompt was:

Describe the outcome of our experiments using the terms theoretical probability and experimental probability.


Tuesday, April 19, 2016

BreakoutEDU: The Simple Machine Mystery

Image result for breakoutedu.com

Today we solved the Simple Machine Mystery!  Much better results this week.  Most all of the groups solved the mystery.  This Breakout is done in small groups which a majority of my kids enjoyed much better than the whole group puzzles!

I don't want to give too much away, so if you are interested in this problem-solving, collaborative, fun, challenging class activity, please go to Breakout EDU and join in the fun!

Also, be sure to join their Facebook group!  It is crazy how many posts are added daily and what great ideas and collaboration!


Monday, April 18, 2016

A Little Bit of This.... a Little Bit of That


Today was a little bit of a catch up day.  


Geometric Sewing - finished up
Think Through Math - must be at 5 lessons passed


Hour of Code - spend some time learning to code/program.


Friday, April 15, 2016

Genius Hour (research and product design)


We spent the entire class researching topics and designing products!  We also completed a Weekly Reflection to guide our hour next week.

Tuesday, April 12, 2016

Geometric Sewing (Aglet)


Every year after taking our Math STAAR test, I like to give my kids a little mathematical art therapy!  I begin with the Kaleidoscopic Octagon, which emphasizes rotational and reflectional symmetry.  Then, I move into geometric sewing.  Basically, this is line design with string.  

Line designs are geometric patterns formed 
entirely by the use of straight line segments that 
produce the illusion of a curve. 

We began by preparing our sewing surface.  I gave each student an 8"x 8" piece of tagboard.  I also gave them each a pattern from a book that is no longer in print titled "String Art...10 Basic Designs."  In fact, it is from so long ago the patterns were originally to be run on a ditto machine!  The patterns may be old, but the excitement is always new!

Once we have cut out the pattern and taped it onto our tagboard, I gave each student a stick pin and we headed to the library.  This may be my students' favorite part... we put the tagboard down onto the carpet and use the stick pin to poke a hole into every dot on the pattern.  I have learned, after YEARS of practice, that pre-poking the holes leads to fewer injuries with needles!

Next, it was time to teach my students how to thread a needle.  There is one rule I have during this entire project... I DO NOT THREAD NEEDLES!


It takes a while to learn how to thread a needle, but I have a very cool way of teaching my students how to thread a needle that involves using tape to make an aglet.  I learned about aglets while watching Phineas and Ferb.   They have an A-G-L-E-T Song!  


Once we had our needle on our thread, the time was up!  AARGH!  We sew tomorrow!

Monday, April 11, 2016

BreakoutEDU: The Spyder Heist

Image result for breakoutedu.com


I am all about problem solving, critical thinking, and collaboration happening in my classroom!  So, when I found out about this incredible program called BreakoutEDU, I was immediately hooked!  


How does it work?


I chose to challenge my classes with The Spyder Heist.


To bring this engaging, challenging, problem solving "game" to my classroom, I had to go though the steps outlined in the Get Started section of http://www.breakoutedu.com/beta/ .

Once, I received my breakout box, it took some time to set up the challenge.  There are instructions to follow to walk you though set up, but I was glad I started working on this about two weeks out to ensure I had everything I needed and all was working according to plan!

It was finally time to play!

Results:

  • 1st period - only one lock to open when time ran out - They ALMOST escaped!
  • 2nd period - only one lock (different from 1st) left to open when time ran out - They ALMOST escaped!
  • 3rd period - only one lock remained - the ALMOST escaped!


Friday, April 8, 2016

Genius Hour: Planning


Just can't say enough about the Genius Hour!  Today we began by discussing how to go about research, note taking, and keeping a bibliography.

  • Research:  The research can be done on our Chromebooks (we are 1-to-1), books, magazines, etc.  Any notes are to be kept in their math journal.  To make working with the bibliography easier, I showed my classes how to open a Google Doc - go to Tools - choose Research.  This opens a search box to the right of the Google Doc.  


Once a student chooses a link from the research box, they are taken to the site.  

  • Note taking/Bibliography:  While at the site, if they choose to write down information in their notes, they were to go back to their bibliography, choose "insert link" and then "cite".  This would put a live link into their bibliography that would allow them to find the site again easily.  By choosing "cite" each resource is numbered and the information is placed at the bottom of the page.  Students use the resource number to number their notes.  I felt that this would be a good use of our resources and make the process of creating a bibliography a little less off-putting.  


I also asked the classes to submit their guiding question through a Google Form to be used as examples next year.  Then, I wanted to refocus their attention back to their project and product, so I asked them to fill out a planning page.  This was added to their orange folder as part of their documentation for the project presentation at our AWEsome Expo in May.

After spending about 40 minutes on their project, we completed the class by filling out a Weekly Reflection.  After I look through them, I will give them back next week to be placed in their orange folders and to be read before starting our next Genius Hour.