We spent all of our math class sewing!
About Me

- Tina Dittrich
- Welcome to my math blog! The purpose of this blog is to help you stay informed about our learning and experiences that have taken place during our math class. I have also included links your child (and you) may want to use in order to supplement math learning in 5th grade.
Thursday, April 30, 2015
Wednesday, April 29, 2015
Geometric Sewing Day 2 (and a little Social Studies)

Social Studies was about the dedication and determination of two groups of soldiers during World War II. The 442nd Infantry Regiment was made up of

We also learned about the Tuskegee Airmen who were the first African American military pilots. This was before the Civil Rights Movement, so they were fighting in a military that still practiced segregation and discrimination. They also came out of World War II as highly respected!
We worked on finishing our World War II Analysis. Most students were able to finish, and they began working on the crossword puzzle.
Math is what they were most interested to get to. However, we had a few housekeeping things to take care of. First, we had to get onto projectshare.org to make sure that they will be ready for their final

Finally, we got to the geometric sewing. We didn't get far...
Tuesday, April 28, 2015
Geometric Sewing (and a little Social Studies)
We began class with Social Studies. We read about World War II and then I asked them to complete a Google Doc that analyzes the war. The answers to the Doc could all be found in today's reading.

We will complete the Doc tomorrow.
We moved into math by playing a Kahoot with our Countdown to STAAR. It's funny, they all seem to believe that since we have finished our testing they NO LONGER KNOW HOW to do any math...

I had to remind them that we do have 5 additional weeks of school, and, as their math teacher, I will be assigning math problems!
However, there is a silver lining.... Geometric Sewing!
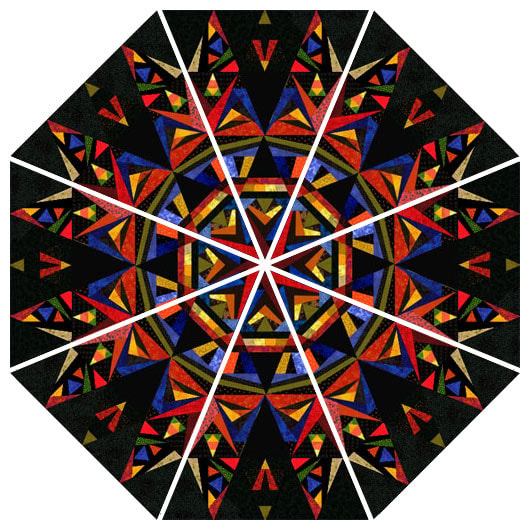
Every year after taking our Math STAAR test, I like to give the kids a little mathematical art therapy! I begin with the Kaleidoscopic Octagon, which emphasizes rotational and
Line designs are geometric patterns formed
We did not get very far today. We spent the few remaining minutes of math class preparing our sewing surface.
Monday, April 27, 2015
Would You Rather: Pennies vs Quarters
Today we problem solved. I posed the problem:
Would You Rather...


After finishing up the assignment, students "turned in" their work through Google Classroom. Then we posted their work to Kidblog .
Would You Rather...
I explained that I had read about a man who had driven to his bank with 500 pounds of pennies in the back of his truck. He had been saving pennies for years and was finally making a deposit.
I told them that I had found this WYR and I thought of the man and his deposit. I had my students open the Google Doc: Would You Rather - Pennies vs. Quarters and I asked them to predict whether they would rather have the pennies or the quarters. I also asked them to explain why.
Next, I asked them to tell me what they KNEW about the problem. They explained that they knew we had 500 pounds of pennies and that each penny's value was $. 01. I asked them what they NEEDED to know. They wondered how many pennies were in a pound. We visited a site that explained, exactly that:
We determined that we would use the number of zinc pennies in a pound. I asked them how we would use the facts that we now had to determine the value of 500 pounds of pennies. I asked the students to create an expression to help us solve the problem. Before beginning, I asked the class to remind me of the difference between an expression and an equation. It took some prompting, but finally, someone in each class remembered that an equation includes an equal sign, while an expression does not. Using our expression (500 x 182 x . 01) the number of pounds times the number of pennies in a pound (91,000) x the value of a penny (. 01) gave us the answer $910 for 500 pounds of pennies.
Next, we followed the same process for the quarters. We KNEW we had 40 pounds of quarters and that each quarter was worth $. 25. What we NEEDED to know was the number of quarters in a pound.
This time our equation (40 x 80 x . 25) gave us a value of $800 for 40 pounds of quarters.
Finally, I asked the students to write a conclusion statement to either defend or refute their prediction:
Friday, April 24, 2015

Thursday, April 23, 2015
Kaleidoscopic Octagon (Reflectional and Rotational Symmetry) Day 2

We completed our Kaleidoscopic Octagons in class today. We published them to the web by taking a picture using our Chromebooks and then importing the image into a Kidblog post. These will be available to view in a day or two.

We completed a Countdown to STAAR using Kahoot. What an easy (and paperless) way to review concepts taught!!!
We also worked on completing our Give a Hoot Don't Pollute coordinate graphing that was assigned on Monday.
Wednesday, April 22, 2015
Tuesday, April 21, 2015
Kaleidoscopic Octagon
Today we visited symmetry. My students know what symmetry is, however, there were a few terms that I wanted them to learn:
- Axis of Symmetry - a line through a shape so that each side is a mirror immage
- Reflectional Symmetry - a type of symmetry where one half is the reflection of the other
- Rotational Symmetry - the shape can be rotated some amount and still looks the same.
Our activity today came from "Kaleidoscopic Octagon: Link Geometry, Measurement, and Art" by Karyn Mazo is from a magazine called Challenge that was published by Good Apple in 1999, Issue 83 pp. 14-15.
In the article, the author gives an idea for explaining the math involved in the art as follows:
Kaleidoscopic Octagon
A lesson in spatial logic, patterning,
geometry and measurement.
The students folded their paper vertically,
horizontally, and diagonally. Using rulers
they measured from the midpoint of their
folds to construct a regular octagon.
Then the students created patterns which
they reproduced in each section of the octagon.
We followed her instructions to create the octagon. Please watch our video: Perfect Octagon from a Square. Then I had the students create a design in one triangular section of the octagon. Since my focus is creating reflectional symmetry and rotational symmetry, I required the students to use a "mira" math reflector. This tool allows the kids to see a reflection of their design in the mira, while also allowing them to see their pencil through the mira in order to trace the design as a perfect reflection.

Here is Mrs. Dittrich's class using the miras to create their kaleidoscopic octagon:


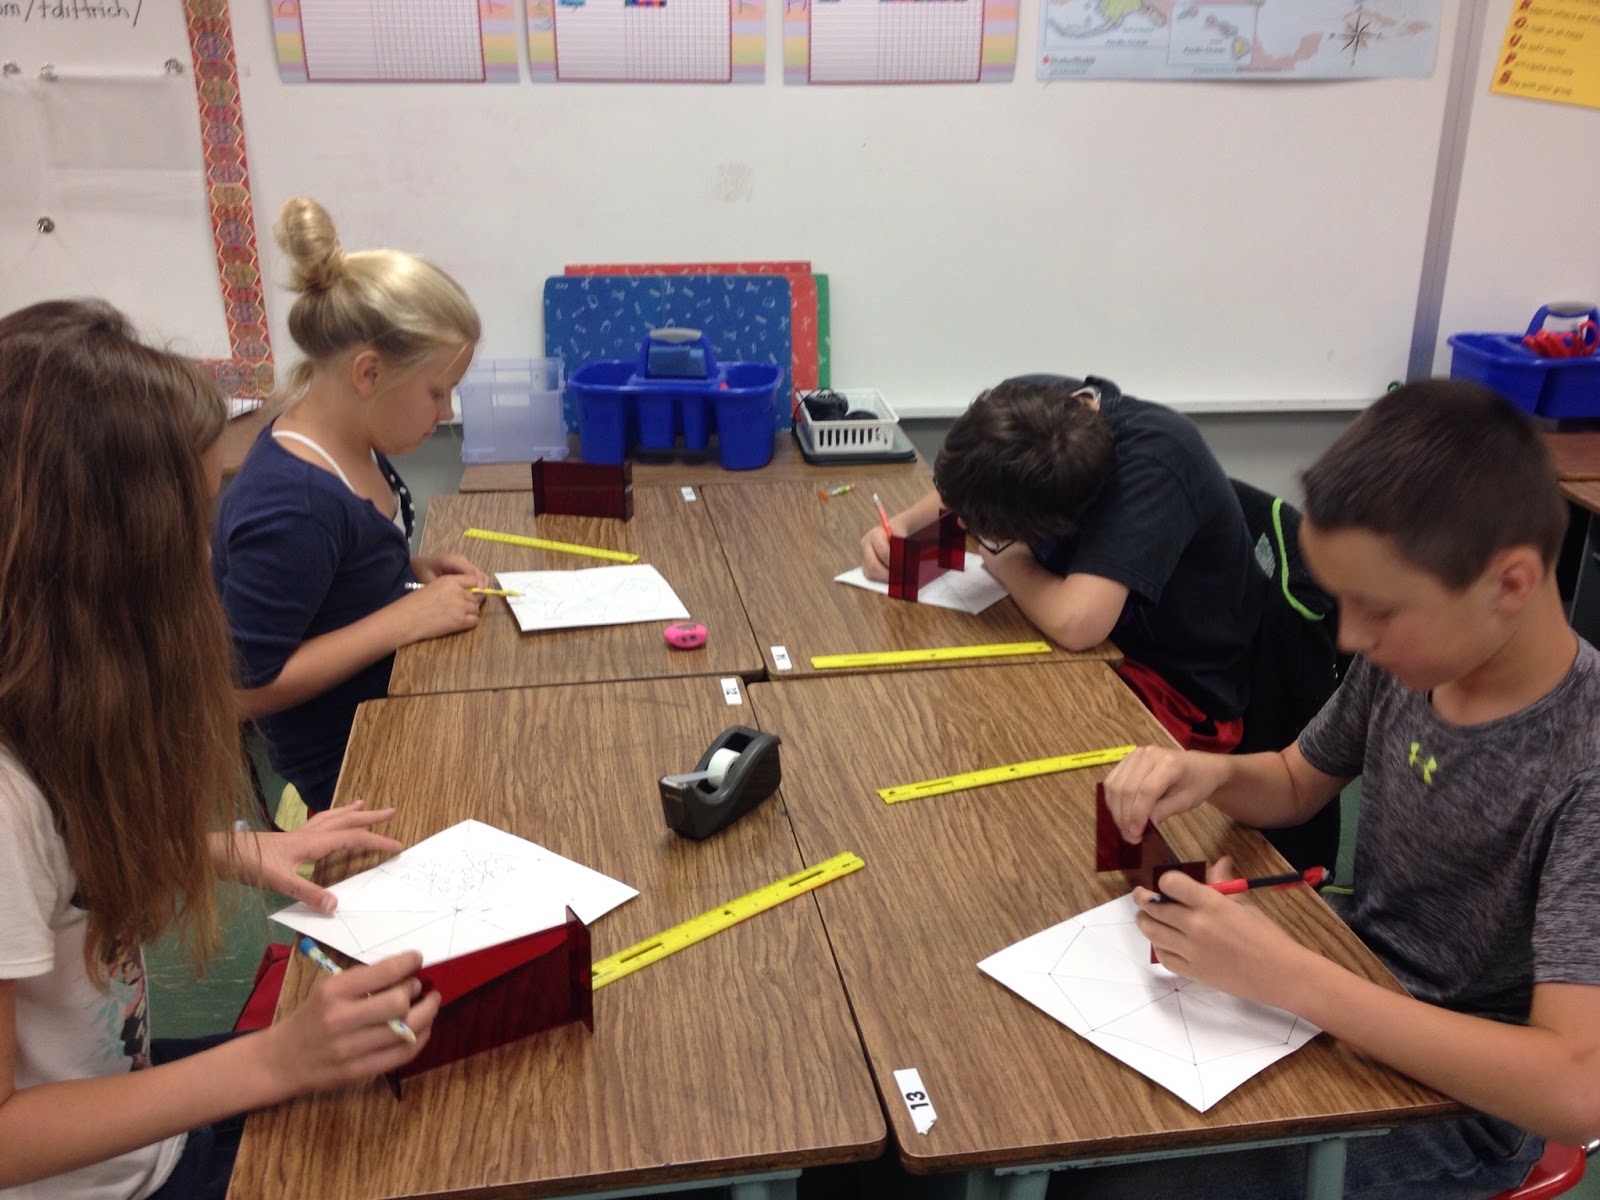


We will finish up the octagons tomorrow.
Monday, April 20, 2015
Friday, April 17, 2015


Thursday, April 16, 2015
Graphing: Analyze Scatter Plots using Kahoot

Today we analyzed Scatter Plots by playing a Kahoot. They did a very good job of reading and analyzing this new kind of graph.
After Kahoot, we completed our last Countdown to STAAR that we will do before our STAAR test on Monday. We will continue to do these for the rest of the year to continue our spiral review.
Finally, we worked on Think Through Math or Khan Academy in order to achieve our goals!
Wednesday, April 15, 2015
Graphing: Scatter Plots using Create a Graph
Today we learned about and worked with Scatter Plots. A helpful activity for teaching this concept was Graphing Scatterplots. We began by making a scatter plot by hand and determining the correlation shown. To see the lesson, please watch Scatter Plot Notes.

Next, I had the kids go to Create a Graph to create scatter plots and save them to a Google Doc. Once the graph was created and on the Google Doc, students needed to determine the correlation of the data. To see the example, which explains how to create the scatter plot, please watch Scatter Plots using Create a Graph. Each student created 3 graphs using tables from their textbook. I am looking for the following:
- Graph title
- X-axis label
- Y-axis label
- Correct data
- Correct correlation statement
Students turned in their Google Doc using Google Classroom and then posted their Doc to Kidblog.
- http://kidblog.org/AWEDittrich/
- http://kidblog.org/AWEWhitehead/
- http://kidblog.org/AWEJohnson/
Tuesday, April 14, 2015
Graphing: Analyze Stem-and-Leaf Plots with Kahoot

We began our day, by playing Kahoot. Our topic was "Analyze Stem-and-Leaf Plots." This was a fun way to practice working with a topic that is still pretty new!
After the Kahoot, we completed a Countdown to STAAR (which is only 3 school days away).
Finally, we worked on either Think Through Math, if close to our Think30 goal, or Khan Academy in order to achieve the goals for that club as well.

Monday, April 13, 2015
Graphing: Stem-and-Leaf Plots

To introduce the concept to my classes, we began by watching a Study Jams called Stem-and-Leaf Plots. This gave step-by-step instructions on how to build a stem-and leaf plot.

Next, we went the Khan Academy and watched the video Stem-and-Leaf Plots. This video has a stem-and-leaf plot that is already created. He is working backwards, showing students how to pull the numbers off of the plot.

Next, we watch a second Khan Academy video Reading Stem-and-Leaf Plots. This time, students were shown how to read a stem-and-leaf plot in order to answer mathematical questions regarding the data.

Finally, we did a Khan Academy activity Reading Stem-and-Leaf Plots. We worked together to solve questions regarding the data.
Now it was time to build our own Stem-and-Leaf plots in our journal. To save time, I used a page from the textbook. This allowed us to make two plots, one using two digits and one using three. Then we found the range for our two plots.


Finally, my students opened their Math Classroom and found their Google Doc assignment: Stem-and-Leaf Plots. They opened the document, solved the problems, turned their paper in, and posted it to Kidblog (all of this with fewer and fewer questions as to "how").
Any remaining time we gave to Think Through Math. This is our final push to earn our Think30 reward! Math STAAR test is on Monday!
Friday, April 10, 2015
Graphing: Dot Plot
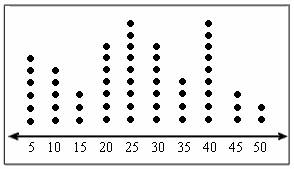
To make a dot plot in class, I wanted to have a little fun. So, I posed the question...
How many drops of water will a penny hold?
I gave each of my six tables a penny, eye dropper, and a container with water. I began by having them predict the number of drops. This prediction is typically around 5... however, the actual data is much higher!
I circled the room, monitoring the drops of water. The dropper cannot be too high from the penny, nor should it be too close. The drops should not be tiny, in fact, they should all be about the same medium size. Be sure not to wiggle the table... and so on and so on.

The kids were shocked to find that a penny holds quite a few drops of water. This is because of the meniscus formed by the water, creating a "bubble" that rises above the penny. This is due to surface tension. Once the surface tension breaks... off flows the water!


Dittrich

Whitehead

Johnson
We noticed that in all of the classes, our second experiment's prediction and data were all much more accurate.
Subscribe to:
Posts (Atom)