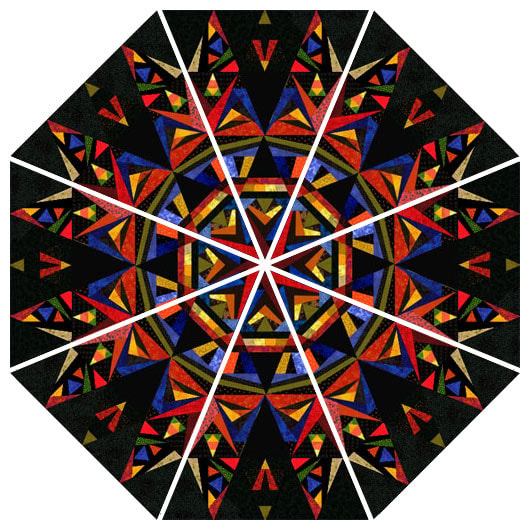
We completed our Kaleidoscopic Octagons in class today. We published them to the web by taking a picture using our Chromebooks and then importing the image into a Kidblog post. These will be available to view in a day or two.
About Me

- Tina Dittrich
- Welcome to my math blog! The purpose of this blog is to help you stay informed about our learning and experiences that have taken place during our math class. I have also included links your child (and you) may want to use in order to supplement math learning in 5th grade.
Thursday, March 31, 2016
Wednesday, March 30, 2016
Tuesday, March 29, 2016
Monday, March 28, 2016
Kaleidoscopic Octagon
Today we visited symmetry. My students know what symmetry is, however, there were a few terms that I wanted them to learn:
- Axis of Symmetry - a line through a shape so that each side is a mirror image
- Reflectional Symmetry - a type of symmetry where one half is the reflection of the other
- Rotational Symmetry - the shape can be rotated some amount and still looks the same.
Our activity today came from "Kaleidoscopic Octagon: Link Geometry, Measurement, and Art" by Karyn Mazo is from a magazine called Challenge that was published by Good Apple in 1999, Issue 83 pp. 14-15.
In the article, the author gives an idea for explaining the math involved in the art as follows:
Kaleidoscopic Octagon
A lesson in spatial logic, patterning,
geometry and measurement.
The students folded their paper vertically,
horizontally, and diagonally. Using rulers
they measured from the midpoint of their
folds to construct a regular octagon.
Then the students created patterns which
they reproduced in each section of the octagon.
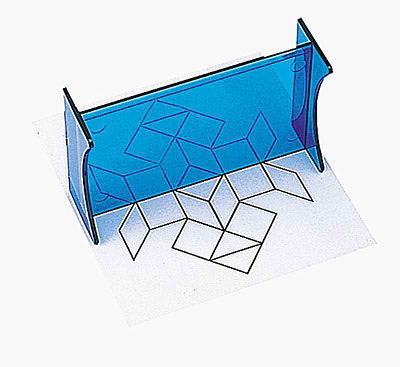
We followed her instructions to create the octagon. Then I had the students create a design in one triangular section of the octagon. Since my focus is creating reflectional symmetry and rotational symmetry, I required the students to use a "mira" math reflector. This tool allows the kids to see a reflection of their design in the mira, while also allowing them to see their pencil through the mira in order to trace the design as a perfect reflection.
Friday, March 25, 2016
Thursday, March 24, 2016
Graphing: Review
Well, we have completed our final unit.... graphing. Today the kids completed a Graphing Review on a Google Form. After today, we have managed to complete all of our required TEKS. Now it's time for the test....
Wednesday, March 23, 2016
Graphing: Analyze Scatter Plots
Today we analyzed Scatter Plots by playing a Kahoot. They did a very good job of reading and analyzing this new kind of graph.
After Kahoot, we completed our last Countdown to STAAR that we will do before our STAAR test on Tuesday. We will continue to do these for the rest of the year to continue our spiral review.
Finally, we worked on Think Through Math.
Tuesday, March 22, 2016
Graphing: Analyze Stem-and Leaf Plots
We began our day, by playing Kahoot. Our topic was "Analyze Stem-and-Leaf Plots." This was a fun way to practice working with a topic that is still pretty new!
After the Kahoot, we completed a Countdown to STAAR. Finally, we worked on either Think Through Math as part of our review.
Monday, March 21, 2016
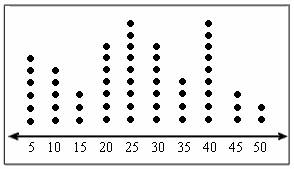
Graphing: Dot Plot
To make a dot plot in class, I wanted to have a little fun. So, I posed the question...
How many drops of water will a penny hold?
I gave each of my six tables a penny, eye dropper, and a container with water. I began by having them predict the number of drops. This prediction is typically around 5... however, the actual data is much higher!
I circled the room, monitoring the drops of water. The dropper cannot be too high from the penny, nor should it be too close. The drops should not be tiny, in fact, they should all be about the same medium size. Be sure not to wiggle the table... and so on and so on.
The kids were shocked to find that a penny holds quite a few drops of water. This is because of the meniscus formed by the water, creating a "bubble" that rises above the penny. This is due to surface tension. Once the surface tension breaks... off flows the water!
We finished off our day with a Countdown to STAAR.
Friday, March 18, 2016
Graphing: Bar Graph
Today we focused on creating and analyzing bar graphs. I had each student go to their math classroom to see their math assignment:
We opened all three of the attachments:
- Alphabet Frequency Homeroom Data
- 5 Most Frequently Used Letters
- Create a Graph
The first document was the spreadsheet that held the data we had gathered yesterday. We had data on the alphabet letter frequency sheet for each table and for each class. We began by comparing the five most frequently used letters in each class. We found that each class had the exact same letters but in different orders of frequency. Next, we combined the data for all three classes to determine the totals for 5th grade. We were thrilled to see that they just reinforced our findings.
Next, we opened Create a Graph and began building our graph. We chose Bar Graph, we gave the graph a title, we labeled the x-axis, we labeled the y-axis, and then we enlarged the data set to 26 to hold all of the letters of the alphabet. Students used the 5th grade data for complete the graph. Then they copied and pasted the graph to their Google Doc and filled in a frequency table for this data. Then they were asked to predict the five letters most frequently used in the English language (most chose to use the letters and order of our 5th grade data).
Finally, they went to letterfrequency.org to find the five most frequently used letters from this site. They filled in a final table and then were asked to draw a final conclusion based on the accuracy of our data as compared to the official data.
Thursday, March 17, 2016
Graphing: Frequency Tables
We have moved into our last unit of study: graphing. We began by working with frequency tables, tables that show how often an event occurs.
I wanted a fun way to introduce the topic, so, I read the book Chrysanthemum by Kevin Henkes. I explained that I wanted the kids to keep track of the frequency that the word "chrysanthemum" was used in the story. It was fun to watch (as I read aloud) the kids trying to remember to make their tally marks as they got lost in the story!
Next, I explained that I wanted my students to use a frequency table to help us answer the question:
What are the five most frequently used
letters in the English alphabet?
I explained that we were going to explore this question by using our names (first, middle, and last). We began with an Individual Data Frequency Table.
I asked the students to make a prediction of the five letters they thought were used the most in the English language. Then we completed our frequency table using our names. Finally, each student used their charted letters to name the letters most frequently used in their name. We compared the actual to our prediction to see how accurate predictions had been and I explained that it is very difficult to make an accurate prediction using such a small sampling of data.
So, now, we combined our data by table groups
Once again, we predicted what the 5 most frequently used letters in the alphabet. This time, however, students used their individual data as their prediction. Table groups worked together to put their combined data onto the frequency table. Once the data was in the table, the students found the five most frequently used letters at their tables.
Now, we needed to combine our data into a class data frequency table. To do this, I shared an editable Google Sheet with my students. One person from each table typed in their data on the sheet. I have to admit, it was pretty fun to watch the projected screen as data was input and the class totals changed before their eyes!
Finally, I asked each class to use their class data to name the five most frequently used letters in their homeroom. We will use this as our prediction for the five most frequently used letters in our class. I explained that we will combine all three classes' data tomorrow to come up with a final prediction as to the five most frequently used letters in the English alphabet.
We finished up our day with a Countdown to STAAR.
Wednesday, March 16, 2016
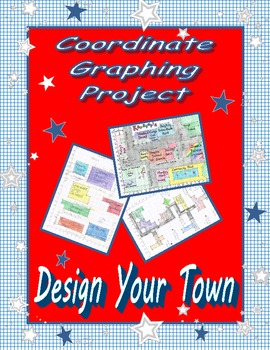
Coordinate Graphing: Design Your Own Town
I have been out the past two days on a trip with my family (their spring break did not coincide with mine), but I wanted learning to happen while I was away. So, I decided to have my students do the following two-day project:
I am always looking for a high-interest way to have my students work with coordinate graphing. My students always love the pictures they can make using ordered pairs, but I wanted something with higher level thinking and application. I found such an activity on teacherspayteachers.com, called Design Your Town.
Day 1, the focus was just on creating the map using grid paper. The students:
- Labeled and numbered their x and y-axis.
- Drew and labeled 7 buildings.
- Plotted and labeled 4 points of interest.
- Included a compass rose.
- Creatively named the town.
- Included streets between the buildings.
- Added color.
Day 2: they went to their math Classroom and open the Google Doc I had assigned. Instead of doing their work on a separate sheet of paper, as stated in the instructions, I asked them to complete the following tables on the Google Doc:
They spent the rest of our class time completing the tables using their maps and ordered pairs.
When I returned to school today, I found that not everyone was able to get finished, so students had about 30 minutes to finish up. Those that had finished were to work on Think Through Math.
We finished off our math class by completing a Countdown to STAAR. Our STAAR test in on March 29 (8 school days).
Friday, March 4, 2016
Measurement Assessment
Happy Birthday Dr. Seuss!
It's Read Across America Day!
We finished up our work with measurement by completing a measurement assessment. I used a Countdown to STAAR Fast Focus set of problems to assess understanding of measurement concepts and conversions.
While the students had a hard copy to work on, they filled in a Google Form with their answers. The new Google Form format is really interesting. You have the option of seeing results in real time pie charts as a summary and as individual student assessment. You still have access to the spreadsheet so that you can use Floobaroo to quickly grade assignments and share results with students.
I also used the Google extension Screencastify to record/video the problems for my students who have accommodations to have work read aloud. I shared the recording/video with my students through Google Classroom.
Happily though:
Have a great Spring Break!
March 7 - 12
Thursday, March 3, 2016
Measurement: Capacity (Customary and Metric) Conversions
We continued our work with measurement by focusing on capacity (how much a container will hold). We completed one more Kahoot, once again working as table groups.
We finished out our day by completing a Countdown to STAAR.
Wednesday, March 2, 2016
Measurement: Weight (Customary and Metric) Conversions
Our topic today was conversion of units using weight and mass.
Weight is the pull of gravity on an object, and we use measurements of ounces, pounds, and tons in America. Weight is measured on a scale and weight changes when you (hypothetically) go to another planet because the amount of the pull of gravity has changed.
Mass, on the other hand, is the amount of matter something contains. It is measured using a balance. The amount of matter does NOT change if you go to another planet, so your mass measurement is constant. All countries (other than the U.S.) use the measurement of mass to determine the amount of matter an object contains (including humans).
I used another Kahoot to present the word problems to my students. I find that my students will work all kinds of math problems, happily, when playing a game. Today, they solved 15 WORD problems without any whining! That is always a good day!
We also spent time working on a Countdown to STAAR. We complete one just about every other day, in an effort to have a spiral review (a review of concepts previously taught).
Tuesday, March 1, 2016
Measurement: Length (Customary and Metric)
Our focus today was working with converting length measurements. We work with both Customary and Metric units. In an effort to make this topic engaging, I created a Kahoot for the classes to play. I used word problems from two books that included factoids that I thought the kids would enjoy:
I also decided to have the classes work in table groups. I felt it was important for there to be student interaction as they worked on solving problems. This would allow to hear and see how problems, involving converting length measurements, could be solved.
Before beginning, we reviewed the hand signals that had been used last year to remind students when to multiply or divide to find their conversions. I also decided to allow the students to use calculators since Kahoots have time limits and I was just checking their knowledge of conversions.
Subscribe to:
Posts (Atom)








.jpg)


