About Me

My photo
Welcome to my math blog! The purpose of this blog is to help you stay informed about our learning and experiences that have taken place during our math class. I have also included links your child (and you) may want to use in order to supplement math learning in 5th grade.

Friday, January 31, 2014

100th Day of School!


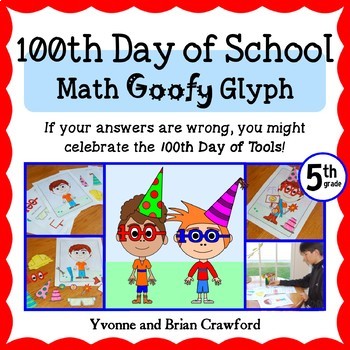
We have made it to the 100th day of school!  To have a little fun with it, I found a 100th Day of School Math Goofy Glyph on Teachers Pay Teachers.


My students had a great time answering the 10 math questions and adding the appropriate item to their person cutout!  Once the "person" is complete, we will be showcasing them on our lockers.

We will use these glyphs to create a bar graph each week for the next few weeks.  We will then use the bar graph to continue practicing finding range, mean, median, and mode of the data.


Thursday, January 30, 2014

Probability: 2 Coin Toss

We continued our work with probability by working with two coins.  We began by defining probability (the likelihood an event will happen).  Today we listed all of the possible outcomes using three different models:  t-chart, branching, and a matrix.  To see our lesson, please watch the video:  2 Coin Toss.


Next, we moved into finding the theoretical probability (what SHOULD happen) when tossing two coins.  We discovered that we should have HT/TH about 1/2 of the time, HH 1/4, and TT 1/4 of the time when tossing.  We also discovered that once we combined all of our data, our pie chart should look like spinner 2 from yesterday. 


Once we had our theoretical probability, we could now experiment.  Each student tossed 2 coins recording whether the coins landed HH, TT, or HT, until there was a "winner" (the first one to reach the end of the row).


We used fractions to describe the results of our experiment. Then, we used our data to determine how close we came to our theoretical probability both individually, and as a class.

Mrs. Johnson's class tossed a total of 613 times.  This meant that their graph should have about 153 TT, 153 HH, and 306 HT combinations.


Mrs. Dittrich's class tossed a total of 534 times.  This meant that there graph should have about 133 HH, 133 TT, and 266 HT combinations.

Mrs. Whitehead's class tossed a total of 587 times.  This meant that their graph should have about 146 HH, 146 TT, and 292 HT combinations.


As you can see from the visuals, all three classes have similar pie charts.  Tomorrow, we will combine all three classes to see if our theoretical probability and our experimental probability are any closer.


To finish out the day, I asked the kids to create a comic strip about probability.  The prompt was:

Create a comic strip that explains the thinking needed to understand probability.

I can't wait to see what they come up with!

HOMEWORK:  Countdown 3.5 and Comic Strip

Wednesday, January 29, 2014

Computer Day

Before heading to the computer lab, we wanted to see how our theoretical probability from our spinners yesterday stood up to the experimental probability we found.  We combined all of the data from the three classes.

For spinner #1, we had a total of 1100 spins.  This meant that each of our four colors should have been spun 275 times.  Here is our complete data with circle graph:


For spinner #2, we also had 1100 spins.  However, with red taking up half the spinner, it needed to have 550 spins while blue and yellow should have had 275 each.  Here is our data and circle graph:


The kids love that the circle graph for each spinner actually looks very similar to the spinner itself!  Theoretically, that is what is SUPPOSED to happen!


The rest of class was spent in the computer lab.  
We worked on khanacademy.org.  

We have a khanacademy.org competition going.  
The benchmarks of the competition are:

KHAN CLUB

30 mastered skills - join the club
42 members

45 mastered skills - Khan t-shirt
23 t-shirts

60 mastered skills - Invitation to Khan Banquet
8 invitations

75 mastered skills - sit at the head table
3 @ the head table

90 mastered skills - medals awarded
2 medalists

HIGHEST Khan mastered skills - "TOP Khan" award
WHO WILL IT BE?!?!

Tuesday, January 28, 2014

Probability with Spinners

I LOVE probability!  It's is probably my favorite of all my units (pun intended!)!  Today we focused on spinners and working with:

  • theoretical probability (what SHOULD happen) 
  • experimental probability (what DID happen)
We began by defining probability.  Probability is the likelihood that an event will happen.  I gave the students a spinner that was broken into fourths.  We found the theoretical probability of landing on each color in fraction form.  Then we discovered how many times we should land on each color if we used our spinner 20 times.  


Once we had determined our theoretical probability, we then worked with the experimental probability.  Each student (and I) spun 20 times and recorded our data.  Next, we compared our individual data to the theoretical data.


Then we combined the data from all the students in each class into a shared Google Sheet and used the "SUM" formula to calculat the totals.  We used our totals to make a circle graph.  Amazingly enough, we found that the circle graphs we created with our data were almost exact replicas of the spinner we began with!  The kids were most impressed!  Here is our data with its circle graph:

Mrs. Dittrich's class spun 320 times, so each color should have had a total of 80.  You can see our data was very close.


Mrs. Dabbs' class spun a total of 380 times, so each color should have had a total of 95.


Mrs. Johnson's class spun a total of 400 times.  Each color should have a total of 100.


We repeated the process with a second spinner.  


We looked at our individual experimental data in comparison with the theoretical data, and then we combined our data into a set of classroom data.  Again, our combined data morphed into a circle graph that looked very similar to the spinner we began with!


Mrs. Dittrich's class spun a total of 320 times.  Red should have been spun 160 times, with blue and yellow being spun 80 times.  You can see from the data and graph below, their experimental data was very close to the theoretical data:


Mrs. Dabbs' class spun a total of 380 times.  Red should have been spun 190 times, with blue and yellow being spun 95 times.  You can see from the data and graph below, their experimental data was very close to the theoretical data:


Mrs. Johnson's class spun a total of 400 times.  Red should have been spun 200 times, with blue and yellow being spun 100 times.  You can see from the data and graph below, their experimental data was very close to the theoretical data:


Tomorrow, we will combine all of the data from the three classes to see how close our experimental data will be to the theoretical data.

Our exit ticket prompt was:

Describe the outcome of our experiments using the terms theoretical probability and experimental probability.


Friday, January 24, 2014

Coordinate Graphing


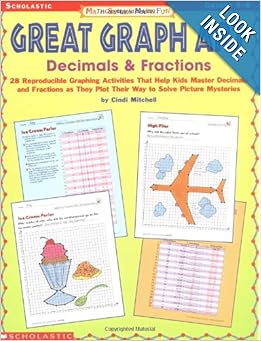
Today we took the ordered pairs that we created yesterday using cross multiplication to plot the coordinates.  As you work connecting the dots, a picture is created.  

Again, this worksheet is from a book called, "Great Graph Art:  Decimals and Fractions" by Cindi Mitchell.


Have a great weekend!

Thursday, January 23, 2014

Comparing Fraction Coordinate Graphing


To begin our math class today, I actually began with a critical writing assignment.  We have been working with changing mixed numbers to improper fractions and improper fractions to mixed numbers and I wanted a little feedback about their thinking.  I asked them to use their notes on page 19 of their journal to assist them in their writing and I posted the prompt:

Which do you prefer, changing improper fractions to mixed numbers or mixed numbers into improper fractions?  Justify your reasoning.

Next, I felt like we needed a little review of two concepts:  comparing two fractions and coordinate graphing.  So I found a worksheet that allows us to practice both.  It is from a book called, "Great Graph Art:  Decimals and Fractions" by Cindi Mitchell.


The worksheet requires the students to create ordered pairs to be graphed.  The x-coordinate is given, but the y-coordinate must be determined by finding the larger fraction and using its numerator.  I allowed the students to practice comparing two fractions using cross multiplication and I also allowed them to use a calculator (this made them very happy!).


We will use these coordinates tomorrow to create a coordinate graphing picture.

HOMEWORK:  Countdown 3.3


Wednesday, January 22, 2014

Mixed Numbers and Improper Fraction BINGO


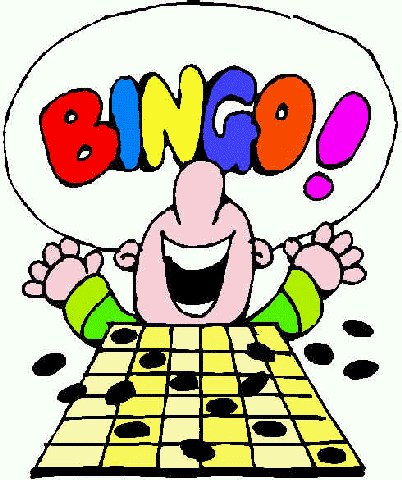
Today we played BINGO as part of the math class.  I found a free bingo download at teacherspayteacher.com.  Each table received a card.  They used dry erase markers to show their work.  As a table, they would agree on the answer and mark the answer on the chart.  We played two games.  The first was improper to mixed and the second game was mixed to improper.  It was a fun way to work with a new concept!

HOMEWORK:  Countdown 3.2

Tuesday, January 21, 2014

Computer Day


Wednesday is normally our computer lab day, however, we needed to switch with another teacher, so we went today.

  We began with changing improper fractions to mixed numbers and then mixed numbers to improper fractions on mathplayground.com.  These are both interactive sites that allow students to practice their new skills.  Please feel free to have your child do these at home!

If there was any remaining time,  then the classes worked on khanacademy.org.  

We have a khanacademy.org competition going.  The benchmarks of the competition are:


KHAN CLUB
  • 30 mastered skills - join the club
  • 40 members
  • 45 mastered skills - Khan t-shirt
19 t-shirts
  • 60 mastered skills - Invitation to Khan Banquet
6 invitations
  • 75 mastered skills - sit at the head table
3 @ the head table
  • 90 mastered skills - medals awarded
1 medalist
  • HIGHEST Khan mastered skills - "TOP Khan" award
WHO WILL IT BE?!?!

Monday, January 20, 2014

Mixed Numbers and Improper Fractions

We worked with Mixed Numbers and Improper Fractions today.  We began by taking notes and making a foldable for our math journals.

First, we focused on Mixed Numbers to Improper Fractions.  To see our notes, please go to:  Mixed Numbers and Improper Fractions.  

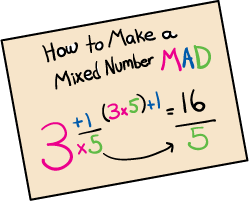
I had found a visual on Mixed Numbers from The Mailbox Magazine:


I liked this little bit of help!  Anything that I can use to help my students remember the steps makes me happy!  In fact, I explained that changing a mixed number into an improper fraction was also like doing a somersault (you move your way around the fraction).

When we turned to improper fractions to mixed numbers, we did not have a fun little helper.   This time, I explained that this set of steps is more like a backflip (you flip from the denominator up into the numerator:  divide).

Once we had taken our notes, we used a "cootie catcher" which I found on Teachers Pay Teachers to practice changing mixed to improper and improper to mixed.  The download is from Runde's Room (one of my favorite blogs to follow).  I gave the students a second "cootie catcher" to use at home.  If you need help in figuring out how to fold it, watch this video:  Cootie Catcher - How To.

We will continue to practice our new skills tomorrow.

HOMEWORK:  Countdown 3.1

Friday, January 17, 2014

College Day in Math

Well, we got a little off topic today.... instead of math, we discussed college.  This topic of conversation has its origins in three things that happened this week:


First, we had the NED Show come to our school this week.  As you can see, the focus of the show is to empower our kids to take ownership of their learning.  


Secondly, Martin Luther King Day is on Monday.  We have encouraged our kids to begin thinking about their dreams!


Thirdly, my husband and I just found out our second daughter was accepted to Texas A&M University!  Whoop!

So, I decided that this would be an appropriate day to discuss colleges and dreams.  While it may have been off topic.... I think the kids enjoyed the discussion and may have been able to think of a "dream" that they can achieve by "never giving up" and "doing their best"!

Have a great weekend!

Thursday, January 16, 2014

How To Compare Fractions


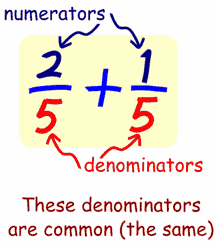
Comparing fractions in fifth grade has gone beyond the pictorial model.  Comparing fractions in fifth grade requires that students look at the denominators and decide a course of action.  Either the denominators are the same (common) and we only need to compare the numerators, or the denominators are different and we need to create fractions with common denominators before we can compare the numerators.


Creating fractions with common denominators is as simple as creating equivalent fractions.  We can either multiply our denominators by a number to create common denominators, or we can simplify our fraction (divide our denominators) to create a common denominator.  However, REMEMBER to do the same action to the numerator!


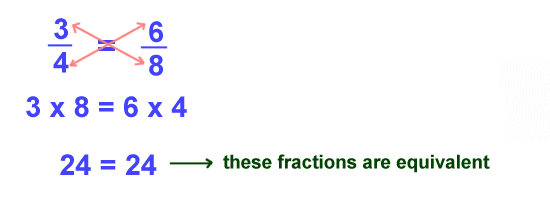
Sometimes it is difficult to find a common denominator easily, so we can also use the strategy of cross multiplication.


To watch our note-taking, please go to:  How to Compare Fractions.

HOMEWORK:  Countdown 2.8

Wednesday, January 15, 2014

Computer Day: MStar


In the computer lab, we focused on (1) taking the winter MSTAR assessment, which you can read about below, and (2) working on Khan Academy.


MStar Universal Screener

The MSTAR Universal Screener is a formative assessment system administered to students to support instructional decisions.
  • The content of the MSTAR Universal Screener is based on algebra-readiness knowledge and skills as identified in the Texas Response to the Curriculum Focal Points.
  • Results can help teachers identify students who might not be ready for algebra and are in need of additional instructional support.
  • Teachers will be able to monitor students' risk status by administering comparable forms of the MSTAR Universal Screener in fall, winter, and early spring.
KHAN CLUB
  • 30 mastered skills - join the club
  • 38 - 5th grade students are part of the Club!
  • 45 mastered skills - Khan t-shirt
  • 18 - 5th grade students have earned their t-shirt!  (picture below)
  • 60 mastered skills - Invitation to Khan Banquet
  • 75 mastered skills - sit at the head table
  • 90 mastered skills - medals awarded
  • HIGHEST Khan mastered skills - "TOP Khan" award