About Me

My photo
Welcome to my math blog! The purpose of this blog is to help you stay informed about our learning and experiences that have taken place during our math class. I have also included links your child (and you) may want to use in order to supplement math learning in 5th grade.

Monday, March 31, 2014

Four Quadrant Coordinate Graphing

We have spent this school year graphing in Quadrant 1 only.  I wanted to have a little fun and give the kids a challenge, so I introduced them to the other three quadrants.

Coordinate graphing is based on plotting points using two coordinates (ie.  3,6).  The first coordinate tells where to move along the x-axis, and the second coordinate tells where to move along the y-axis.  Up to this point my students have only worked with positive coordinates.  This means they have only worked in Quadrant 1 (+,+).  We began by taking notes and working with a small picture to practice our new knowledge.

The four quadrants are as follows:

  • Quadrant 1 (+, +) or right and up
  • Quadrant 2 (-, +) or left and up
  • Quadrant 3 (-, -) or left and down
  • Quadrant 4 (+, -) or right and down
To see how this was explained, please watch:  Four Quadrant Coordinate Graphing.

Once we had a little practice.... I posed the challenge.... complete the Mystery Picture.  This is NOT homework for tonight!  They have all week to work on it as time allows.  I would like it turned in on Friday.

Remember.... Math STAAR test is tomorrow!


Friday, March 28, 2014

Would You Rather?

Today we problem solved using another Would You Rather...?  These activities come from the website:


Today's problem was:

Would You Rather....


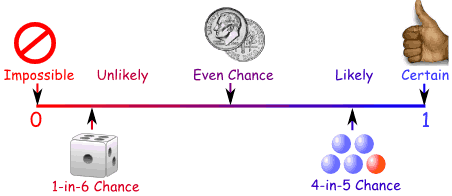
I was thrilled to find this problem!  It connects back to the activities we performed with probability (Two Coin Toss and Dice Dilemma).

I began by asking the kids to think about the above problem and discuss their reasoning with their table group.  After a few minutes discussion, they were to make a choice and explain their reasoning.  Since this is the third or fourth time we have worked on a "Would You Rather," they are much more willing to write something that they may or may not change later.


Once we had our predictions, we began to find our theoretical probability (what SHOULD happen).  We also mentioned that we had to take into account that luck is also involved.... you never know what will happen!


The information was the same for each class:

  • Game A had a 50% probability of winning and the payoff was only $3 a win.
  • Game B had a 55% probability of winning and the payoff was only $1 a win.
At this point, some minds were beginning to change.... but not everyone had a solid of idea of why.


So, now we moved on into our favorite part.... experimental probability (data gathering)!  We began by working with Game A.   We created a table to hold our data.  I gave each student two pennies and we tossed them 10 times.  Each time we logged our outcome on the table.  We determined how much money we had won or lost.  Then we compiled all of the classes data together to see how this game held up to our theoretical probability.

Theoretically we should have won 50% of the time:
Johnson's class won 37% of the time

Dittrich's won 50% of the time


Whitehead's class won 10% of the time!

We also discovered that if we won this game only 50% of the time, we would never break even.... we would lose $10!


Now, we needed to test Game B.  We set our table up in the exact same way.  We rolled the dice 10 times, logged our outcomes on our tables, and compiled the classes' data.

Theoretically, we should have won 55% of the time.

Johnson's class won 60% of the time.


Dittrich's class won 58% of the time


Whitehead's class won 55% of the time

Again, if we won only 55% of the time we would still lose about $2.

At this point, I asked the kids to write their new answer to "Would You Rather..."  I explained that they did not have to change their game choice if they felt that they could mathematically prove their reasoning, but that their reasoning should have changed from just "because I think" to more of a "because I know".

After they chose the game they felt had a better probability of winning and, therefore, making them some money.  I had each student create a new table for the chosen game, play the game 10 more times, combine the data with their first game and write a conclusion about their choice of game.

FUN FRIDAY!


Thursday, March 27, 2014

Stem-and-Leaf Plots

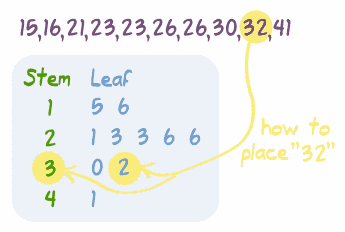
I love stem-and-leaf plots.... I don't know why.... I just do!  A stem-and-leaf plot uses place value to organize the data.  The stem in the case above, represents the 10's place.  The leaves represent the 1's place.  It is a very easy way to see data.


To introduce the concept to my classes, we began by watching a Study Jams called Stem-and-Leaf Plots.  This gave step-by-step instructions on how to build a stem-and leaf plot.  


Next, we went the Khan Academy and watched the video Stem-and-Leaf Plots.  This video has a stem-and-leaf plot that is already created.  He is working backwards, showing students how to pull the numbers off of the plot.  


Next, we watch a second Khan Academy video Reading Stem-and-Leaf Plots.  This time, students were shown how to read a stem-and-leaf plot in order to answer mathematical questions regarding the data.  


Finally, we did a Khan Academy activity Reading Stem-and-Leaf Plots.  We worked together to solve questions regarding the data.

Now it was time to build our own Stem-and-Leaf plot in our journal.  First, we gathered our data from "How Many Drops of Water Does a Penny Hold?"  This time we used the "tails" data.  We noticed that there was one value that was much larger than the rest of the data.  We determined that this would be an outlier and would skew the data, so we decided to terminate this value from our data.


Now we created a title in the journal.  We created our stem-and-leaf plot table.  Then we placed the "tails" data on the table in order from least to greatest.  


Now were were able to analyze the data finding the range, mode, median, and mean.


I then gave an assignment where they analyzed a given stem-and-leaf plot and wrote 6 conclusions based on their observations.

State five conclusions Mrs. Jacobs could make about her students' performance.  Make reference to words such as range, mode, mean, and median in your conclusions.  What do you think the unit of study was?  Why?

I found this idea in the book:  Good Questions for Math Teaching:  Why Ask Them and What to Ask (Grades 5-8) by Lainie Schuster and Nancy Canavan Anderson (p. 119).

HOMEWORK:  Countdown 6.6

Wednesday, March 26, 2014

Computer Lab


Computer Lab Day


KHAN CLUB

30 mastered skills - join the club
52 members

45 mastered skills - Khan t-shirt
40 t-shirts

60 mastered skills - Invitation to Khan Banquet
22 invitations

75 mastered skills - sit at the head table
10 @ the head table

90 mastered skills - medals awarded
4 medalists

HIGHEST Khan mastered skills - "TOP Khan" award
WHO WILL IT BE?!?!

Tuesday, March 25, 2014

Line Plots (with Data Characteristics)


Line plots.... a great way to organize data (especially when you have many values).  To explain line plots, I began by having the students watch a short Study Jams video.  Then I asked them to get out their data from yesterday's activity:  How Many Drops of Water Does a Penny Hold?  We combined all three classes data from the "heads" experiment to work with.


In their journal, we created a blank line across the bottom of the page and gave our line plot a title.  Next we used our list of data to find our greatest value (27) and our smallest value (13).  We used these to values to determine how to label our line plot.  We began with 13 and continued to 27.  Our next step was to place an "x" above each value that we had listed.  

Once the line plot was ready, we could analyze our data.  We could easily find range (27-13 = 14).  We could easily find our mode (20).  We used our calculator to find the mean (386 divided by 18 = 21).  We were able to easily find the median by making off the greatest and smallest until we were left with 20.


To finish off the lesson, we needed to revisit our vocabulary terms from yesterday:  cluster, gap, outlier.  Cluster was easy to demonstrate as our data naturally formed a cluster.  I asked the classes to put a fake outlier on their line plot.  This allowed us the see the difference between the outlier and the cluster.  It also allowed us to find the gap between.


To finish up the class, I gave the kids an activity from the book:  Good Questions for Math Teaching:  Why Ask Them and What to Ask, Grades 5-8 by Lainie Schuster and Nancy Canavan Anderson.  The activity description is on p. 117.  It gives the students 5 plots that do not have titles.  The students are to match the titles to the line plot.  The students were also presented with three questions.  I asked them to choose only 1.  They either needed to explain why they selected the line plot for Set D; or they needed to explain why they didn't choose the other line plots for Set D; or they could determine a title for Plot 4 and explain their reasoning.

HOMEWORK:  Countdown 6.5

Monday, March 24, 2014

Drops of Water on A Penny


The topic of our lesson today was data characteristics.  We took notes about outliers - values on a number line much larger or much smaller than the other values.  We also defined a cluster in math as groups of values "clustered" together on a line plot.  Finally, we defined a gap on a line plot as large space where there are no values.


However, before we could work with these new terms, we needed to gather our data.  Hence, the experimental question.... "How many drops of water can a penny hold?"  I gave each of my six tables a penny, eye dropper, and container with water.  I began by having them predict the number of drops.  This was usually around 5... but the actual data is much higher!

I circled the room, monitoring the drops of water.  The dropper cannot be too high off the penny, nor should it be too close.  The drops should not be tiny, in fact, they should all be about the same medium size.  Be sure not to wiggle the table.   So on and so on.


The kids were shocked to find that a penny holds quite a few drops of water.  This is because of the meniscus formed by the water, creating a "bubble" that rises above the penny.  This is due to surface tension.  Once the surface tension breaks.... off flows the water.

We completed the experiment for both the heads and tails of the penny.  Each group found the mean number of drops.  We gathered the class data together on our sheets and proceeded to find the range, mean, median, and mode for the number of drops of water held on the head of a penny and for the tail of the penny.


We will use the data tomorrow from all three classes to create a line plot and look for outliers, clusters, and gaps in our data.

HOMEWORK:  Countdown 5.8

Friday, March 21, 2014

3-D Figures (Pyramids and Curved Surface)

We finished our note taking on 3-d figure nets today.  It meant more cutting, folding, and taping, but the kids enjoyed it!  We began by determining the critical attributes of pyramid nets.  These nets will have multiple triangles and a single polygon base.


One of our nets was a pentagonal pyramid (like the one above).  We knew this net would become a pyramid due to the triangles, and we new to name it a pentagonal pyramid due to the pentagon base.  We worked with 5 different pyramid nets finding each net's number of faces, number of edges, and number of vertices.  We also looked for patterns to help us find the edges and vertices since looking at a picture can be deceiving.  For example, if you look at the pentagonal pyramid net, you might think that the solid figure itself might have 17 edges (by counting each black line) when it only has 10 as seen on the model, not the net.  You  might also conclude that the figure has 10 vertices (counting every point you see) when it only has 6, as seen on the model, not the net.


We then moved to working with nets for curved surface 3-d figures.  This was very easy for the classes.  The only point of contention was whether or not a cone and cylinder have edges.  After looking at different resources, we concluded that a cone has 1 curved edge (0 straight edges) and a cylinder has 2 curved edges (0 straight edges).

Fun way to end the week!


Thursday, March 20, 2014

Computer Day


Computer Lab Day


KHAN CLUB

30 mastered skills - join the club
52 members

45 mastered skills - Khan t-shirt
37 t-shirts

60 mastered skills - Invitation to Khan Banquet
16 invitations

75 mastered skills - sit at the head table
7 @ the head table

90 mastered skills - medals awarded
2 medalists

HIGHEST Khan mastered skills - "TOP Khan" award
WHO WILL IT BE?!?!

Wednesday, March 19, 2014

3-D Figures and Their Nets


A "net" is a pattern you can cut and fold to make a  model of a solid shape.  Easy enough, except 5th graders need to be able to name the 3-d shape that the net is depicting.  So, it was time to get out some nets, scissors, tape, and our journal!


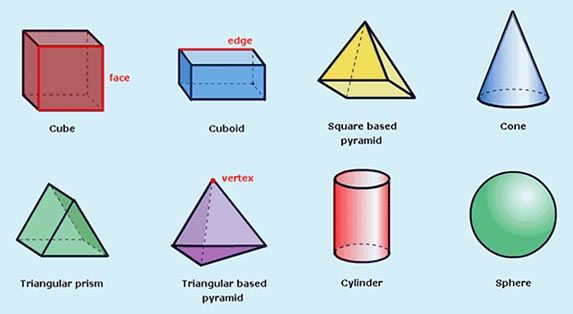
The learning goal today was to identify 3-d figures by using their critical attributes.  We began by defining 3-d figures.  The kids explained that 3-d figures are solids.  They also explained they have volume so there is a length, width, and height to the shape.  When asked how we would describe a 3-d figure, I was told that we use the faces, edges, and vertices.  I asked if they could name the types of 3-d figures and after a little prodding, they came up with Prisms, Pyramids, and Curved Shape Figures.


Now the fun could begin.  I gave the students a set of nets and a set of 3-d figure illustrations.  We began with prisms.  I explained that we can determine whether a net is depicting a prism by looking for two defining features:


  1. The net should have 2 congruent polygon bases.
  2. The remaining faces should all be rectangles.
So, we looked through our nets for figures that were mostly rectangles.  We found nets for a rectangular prism, cube, triangular prism, octagonal prism, and pentagonal prism.


We found that we could determine the name of the prism by using the bases that were not rectangles.  For example, the net that had rectangular faces and two pentagons was a pentagonal prism.

As we found a prism net, we took the time to cut it out and fold it.  Then we found the matching illustration.  Using these two models, we named the number of faces (2 bases + rectangular faces), edges, and vertices.  We began to find that there was a pattern with the number of edges and a second pattern when finding vertices.


We taped each of the nets with their notes into the journal for safekeeping.

We did not finish working with nets today....we still have to do pyramids and curved surface figures.  The kids really enjoyed the lesson and I find that the more tactile the activity, the more likely it will remain in the brain.

HOMEWORK:  Countdown 5.7

Tuesday, March 18, 2014

Transformations


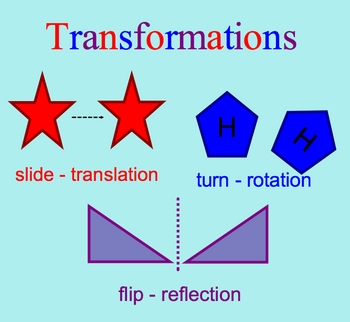
Today we worked with transformations (translations, reflections, and rotations.  Once again, I came across this lesson in


Interactive Math Journal from Runde's Room on teacherspayteachers.com. If you would like to watch the recording of the lesson, please visit:  Transformations.


We began by preparing our journal for our notes.  We wrote our learning goal:

Identify, perform, and describe a translation,
reflection, and rotation.

Next, we prepared our blank grid by labeling our x axis, our y axis and numbering our lines vertically and horizontally.  We also prepared the sections where our work would be shown.

We worked with a translation first.  

  • We named the points of the trapezoid using ordered pairs (x coordinate, y coordinate OR run, jump).
  • We translated the trapezoid 6 units east (making a very simple compass rose to remind us of directions).
  • Then we named the new ordered pairs of the trapezoid that had been translated.
We moved on to reflections.


  • We named the coordinates of the square in its original position.
  • We reflected across Line R.
  • We named the coordinates of the new placement of the square (noting that two points remained the same).
Finally, we looked at rotations.


  • We named the coordinates of the right triangle.
  • We rotated the triangle using Point J.
  • We named the new coordinates of the rotated triangle noting that Point J's coordinates remained the same.
I closed each lesson by asking the kids to talk to me about their new learning.  Someone in each class was happy that I had shown how to translate a figure so many units in a given direction.  Others really liked rotating the triangle.  They thought it was funny that I used a compass rose in math and taught them my memory device (Never Eat Sour Watermelon).  I noticed that this was a good catch for some students who are still working the coordinates backwards by going up the y-axis and then going across the x-axis.  They all really enjoy getting to cut, tape, and use map pencils!

HOMEWORK:  Countdown 5.6