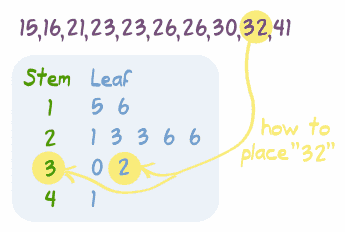
To introduce the concept to my classes, we began by watching a Study Jams called Stem-and-Leaf Plots. This gave step-by-step instructions on how to build a stem-and leaf plot.
Next, we went the Khan Academy and watched the video Stem-and-Leaf Plots. This video has a stem-and-leaf plot that is already created. He is working backwards, showing students how to pull the numbers off of the plot.
Next, we watch a second Khan Academy video Reading Stem-and-Leaf Plots. This time, students were shown how to read a stem-and-leaf plot in order to answer mathematical questions regarding the data.
Finally, we did a Khan Academy activity Reading Stem-and-Leaf Plots. We worked together to solve questions regarding the data.
Now it was time to build our own Stem-and-Leaf plot in our journal. First, we gathered our data from "How Many Drops of Water Does a Penny Hold?" This time we used the "tails" data. We noticed that there was one value that was much larger than the rest of the data. We determined that this would be an outlier and would skew the data, so we decided to terminate this value from our data.
Now we created a title in the journal. We created our stem-and-leaf plot table. Then we placed the "tails" data on the table in order from least to greatest.
Now were were able to analyze the data finding the range, mode, median, and mean.
I then gave an assignment where they analyzed a given stem-and-leaf plot and wrote 6 conclusions based on their observations.
State five conclusions Mrs. Jacobs could make about her students' performance. Make reference to words such as range, mode, mean, and median in your conclusions. What do you think the unit of study was? Why?
I found this idea in the book: Good Questions for Math Teaching: Why Ask Them and What to Ask (Grades 5-8) by Lainie Schuster and Nancy Canavan Anderson (p. 119).
HOMEWORK: Countdown 6.6


No comments:
Post a Comment